Explainer: The METR Chart and Exponential AI Progress
The METR chart is a key measure of AI progress. I didn't quite find a basic, non-technical explainer for policymakers, so I took a stab at it myself.

The METR chart is a widely discussed measure of AI progress. While no benchmark translates perfectly into real-world impact, it’s one of the central indicators for tracking AI agents’ ability to autonomously solve tasks. If a busy and overworked policymaker only had time to track one indicator, it should arguably be this chart. I’ll get to the nuances below, but the key message is:
AI’s ability to solve complex software tasks without human oversight is growing at an exponential rate.
The best AI models in 2023 could autonomously solve tasks that require humans a few minutes, such as fixing simple bugs in computer code. The best models today can solve tasks that require humans 8 hours or more, such as building a complete software library from scratch or fine-tuning a language model.
Researchers from METR, a non-profit organization, publish and continuously update the chart. It is a key reference for the International AI Safety Report, the world’s most comprehensive synthesis of the science of AI capabilities and risks. Various experts are building on the chart in their own work, for example on forecasting future AI capabilities, the reliability of AI systems or drawing out AI’s economic implications. Others have questioned the underlying methodology; one of the authors has explained in response why he takes the central findings to withstand this criticism.
Here, I’ll focus on explaining the main idea behind the METR chart in non-technical terms, including its implications for evidence-based, forward-looking AI policy.
What does the chart say?
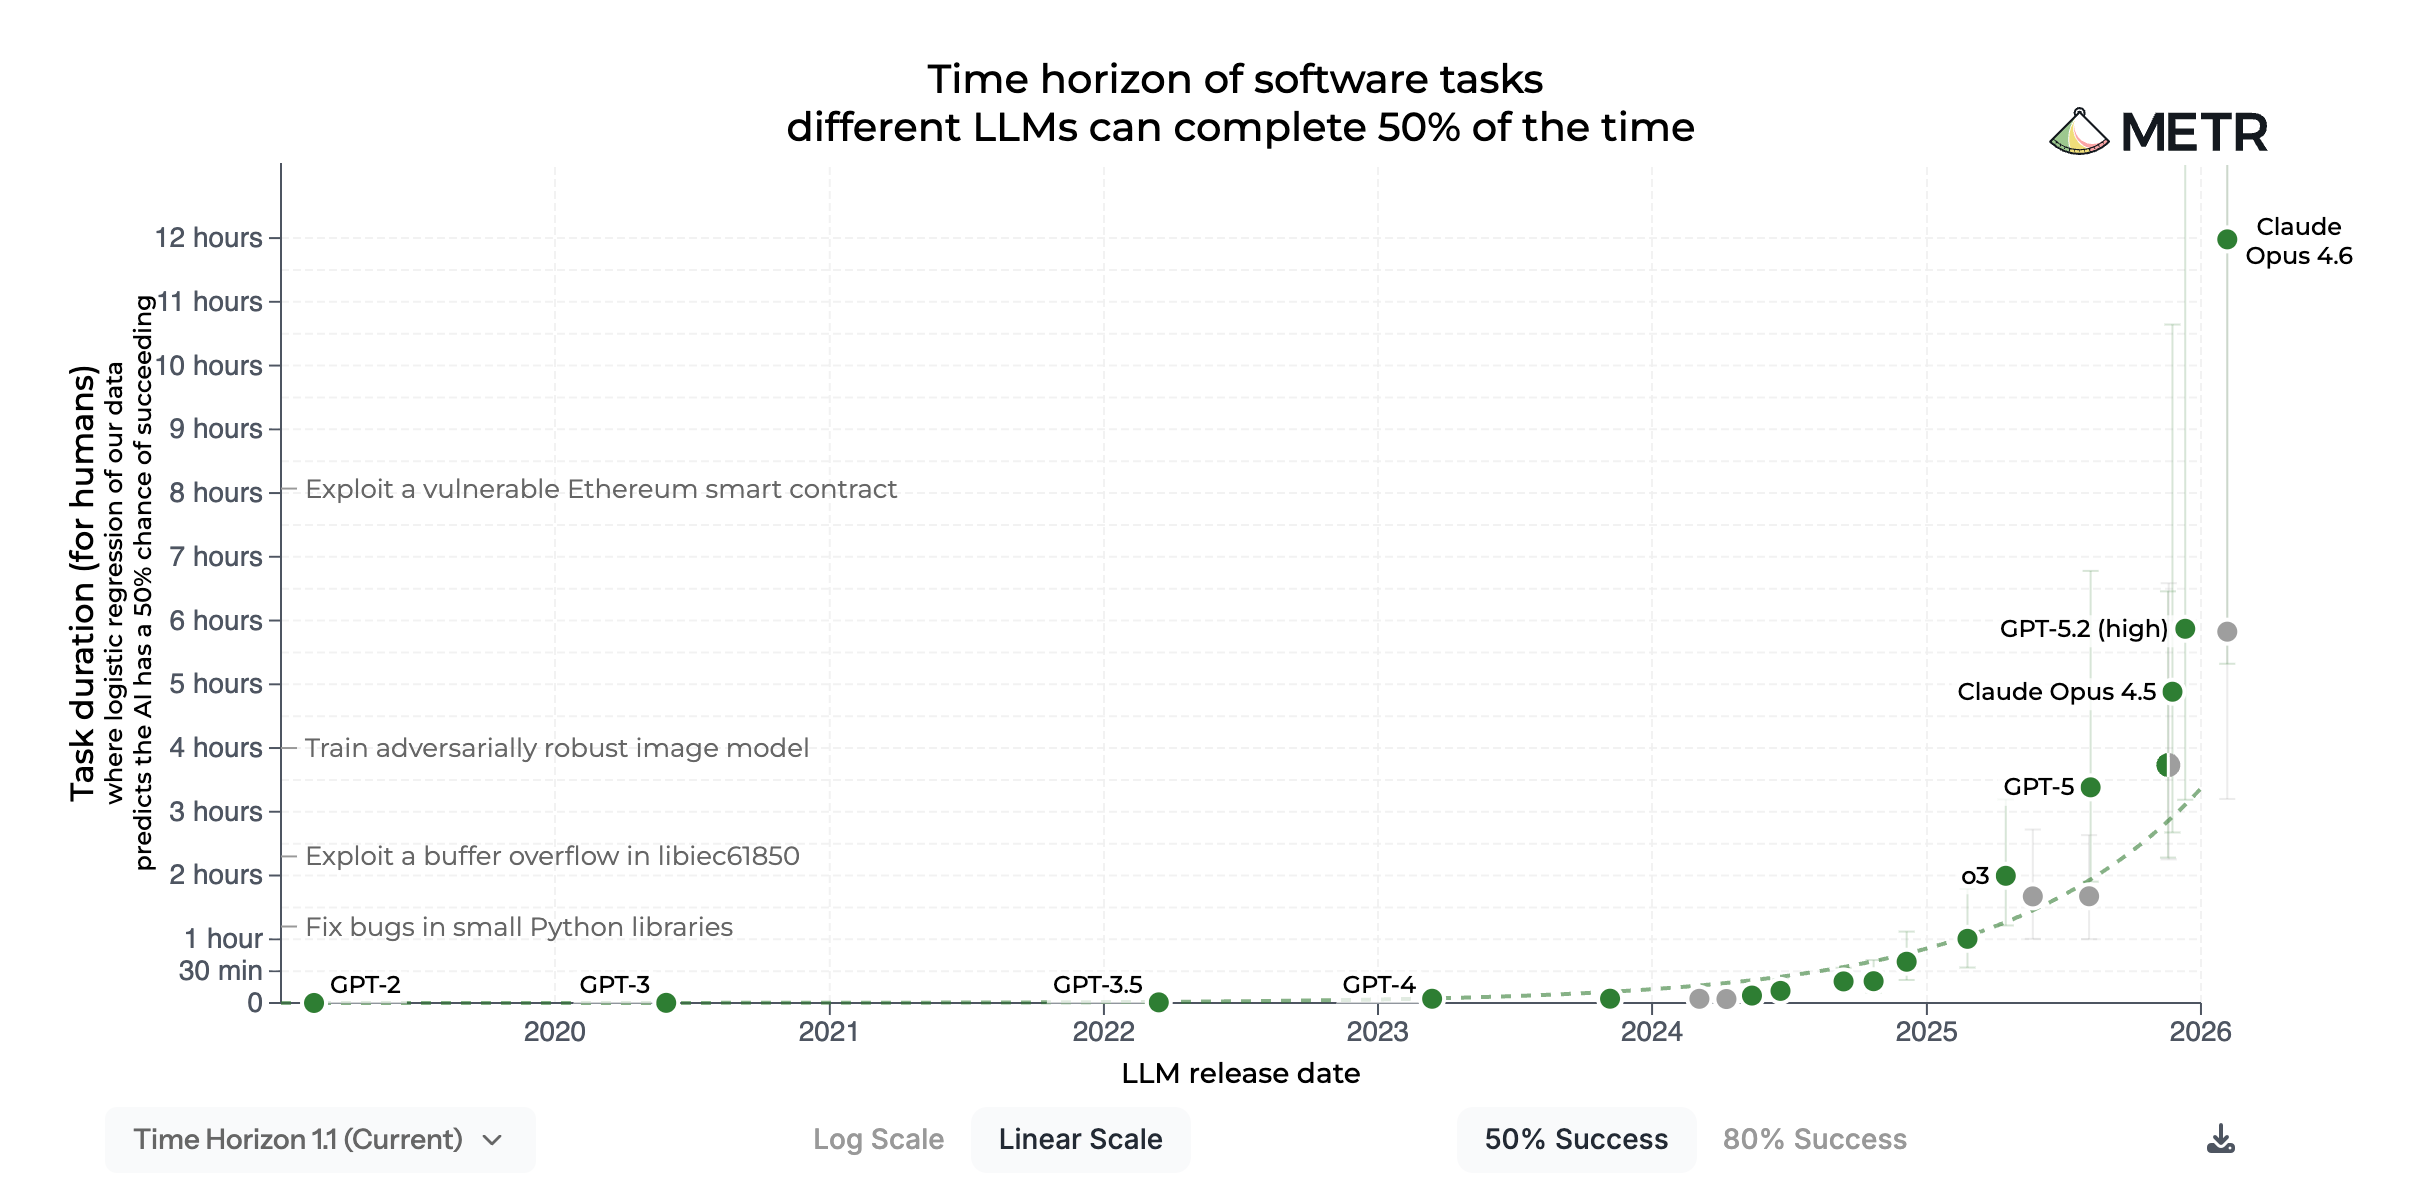
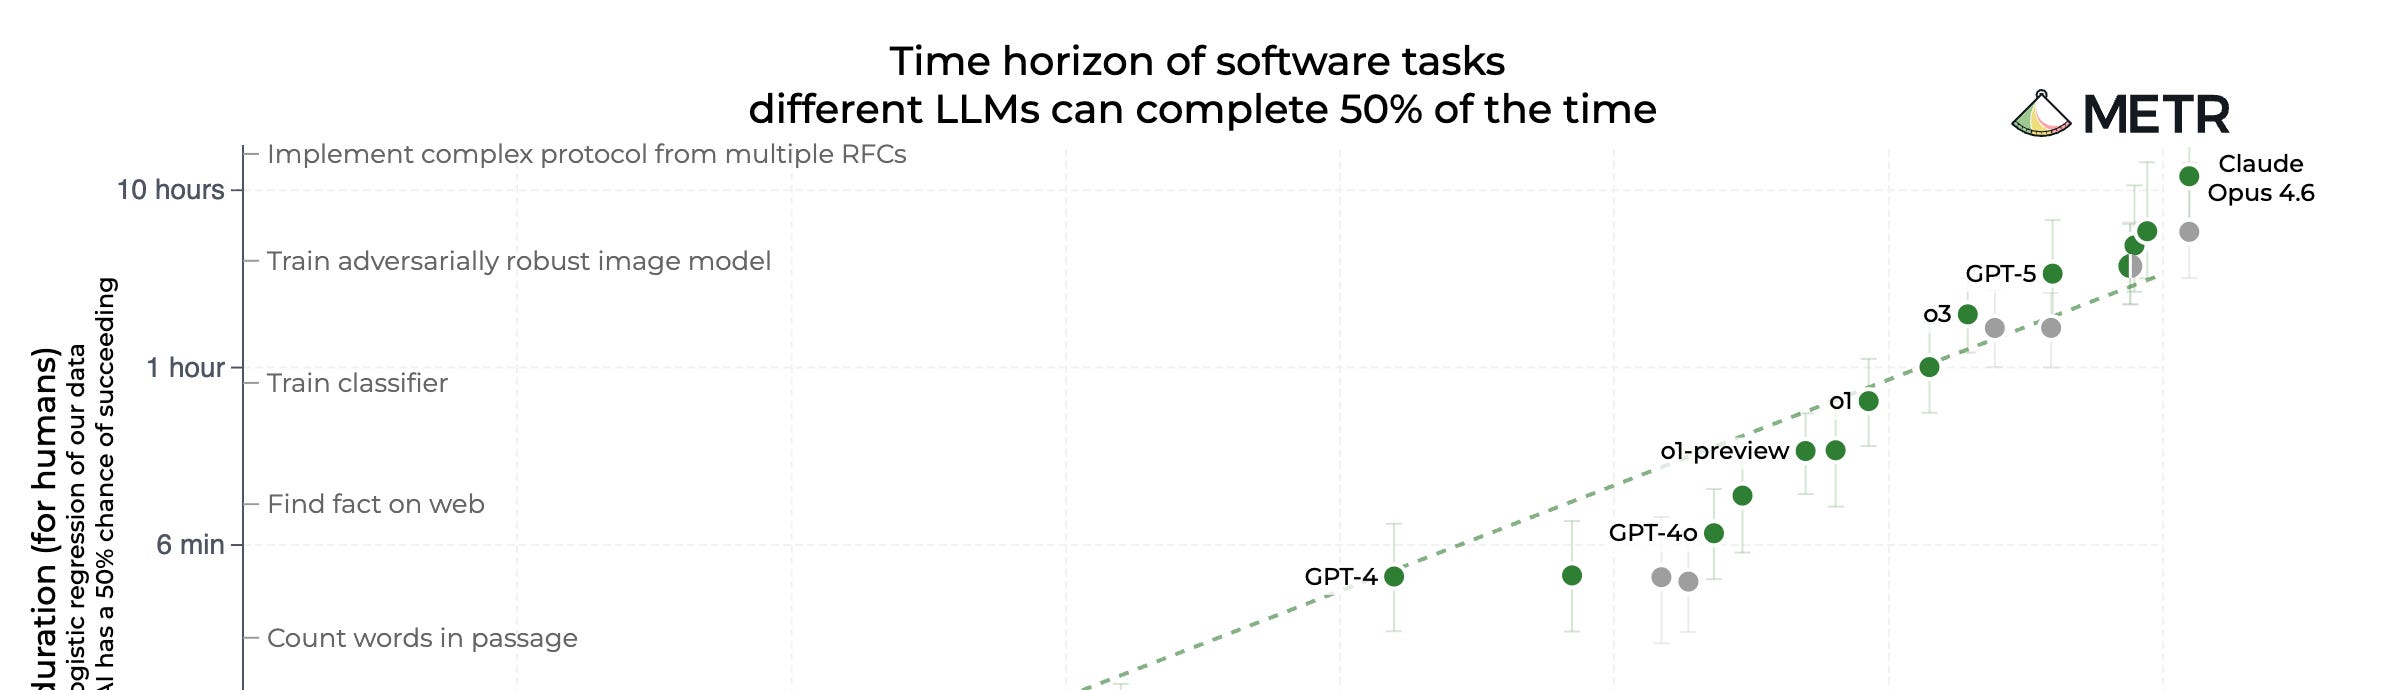
In the chart above, the x-axis shows when an AI model was released. The y-axis shows what METR calls a model’s time horizon – a measure of the complexity of tasks that an AI model can perform.
Time horizons are calculated in three steps. First, researchers record how long it takes human experts to complete various tasks, ranging from a few seconds to several hours or more. Second, they estimate how likely an AI model is to complete a given task depending on how long it takes a human to solve it. Third, a model’s time horizon is then just the human task length at which the model’s success probability reaches a given threshold, such as 50%.1 The longer the time horizon, the more complex the tasks that an AI model can solve.
The figure above shows the most complex tasks that AI models can successfully complete 50% of the time. One might think that this isn’t relevant in practice, because many real-world tasks require greater reliability. The figure below is a version of the METR chart for a reliability level of 80%. While time horizons are shorter on this chart, it retains the exponential shape – and so the general trend stays intact even at higher reliability levels.
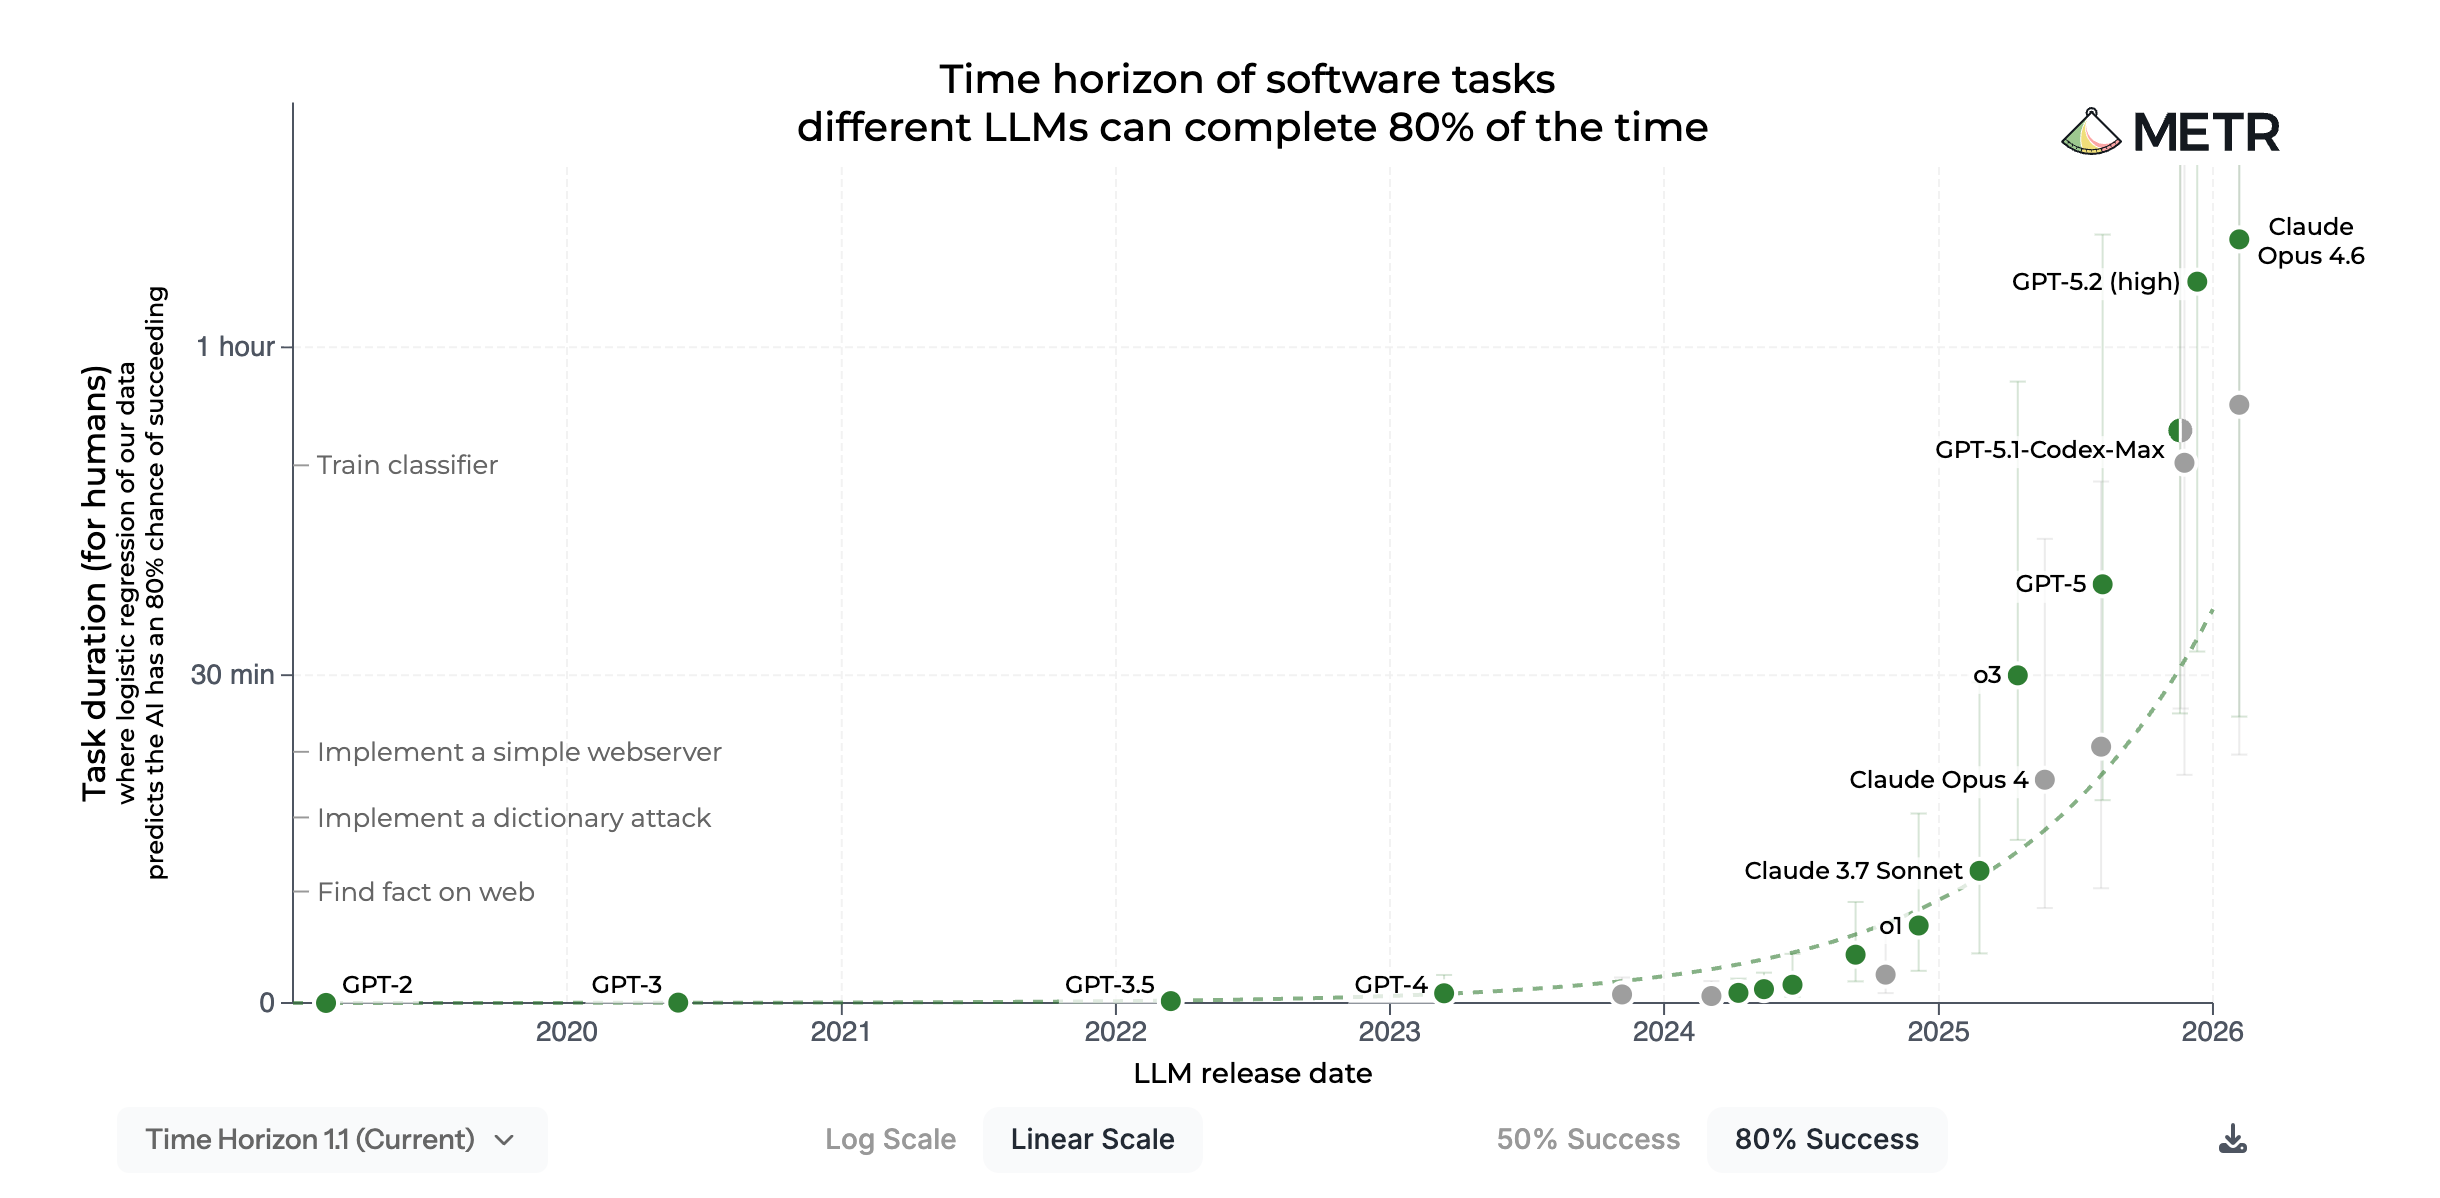
In the rest of this post, I use “the METR chart” to refer to the 50%-reliability version and make four policy-relevant observations about this chart.
1. AI capability progress is very fast.
Over the past years, time horizons have doubled around every 7 months. At the time of writing, the most capable model is Claude Opus 4.6 with a time horizon of 12 hours (though this specific number is likely noisy, for reasons I explain below). If the exponential (or perhaps even superexponential) trend continues, AI models would be able to complete week-long tasks in 2028, month-long tasks in 2029 and year-long tasks in 2031.
It’s not even clear what time horizons would mean beyond that point: Since it might be possible to split even very complex problems into individual chunks that it would take a human a year to solve, an AI model with a year-long time horizon might be able to solve any task that a human can solve in the relevant domain.
One complication here is that the exact time horizon of an AI model shouldn’t be taken too literally. Time horizons are calculated by paying humans to actually solve certain tasks. This experimental setup leaves room for measurement error, reflected in the (increasingly large) confidence intervals around each estimate.
The key point is: The exponential trend is more important than the specific time horizon estimates. If that trend continues – and so far, we’ve seen little evidence against this – it doesn’t matter whether an AI model’s “true” time horizon is currently at 12 or 16 hours. Policymakers should watch the slope of the curve more than our current point on it.
2. The evidence even suggests accelerating progress.
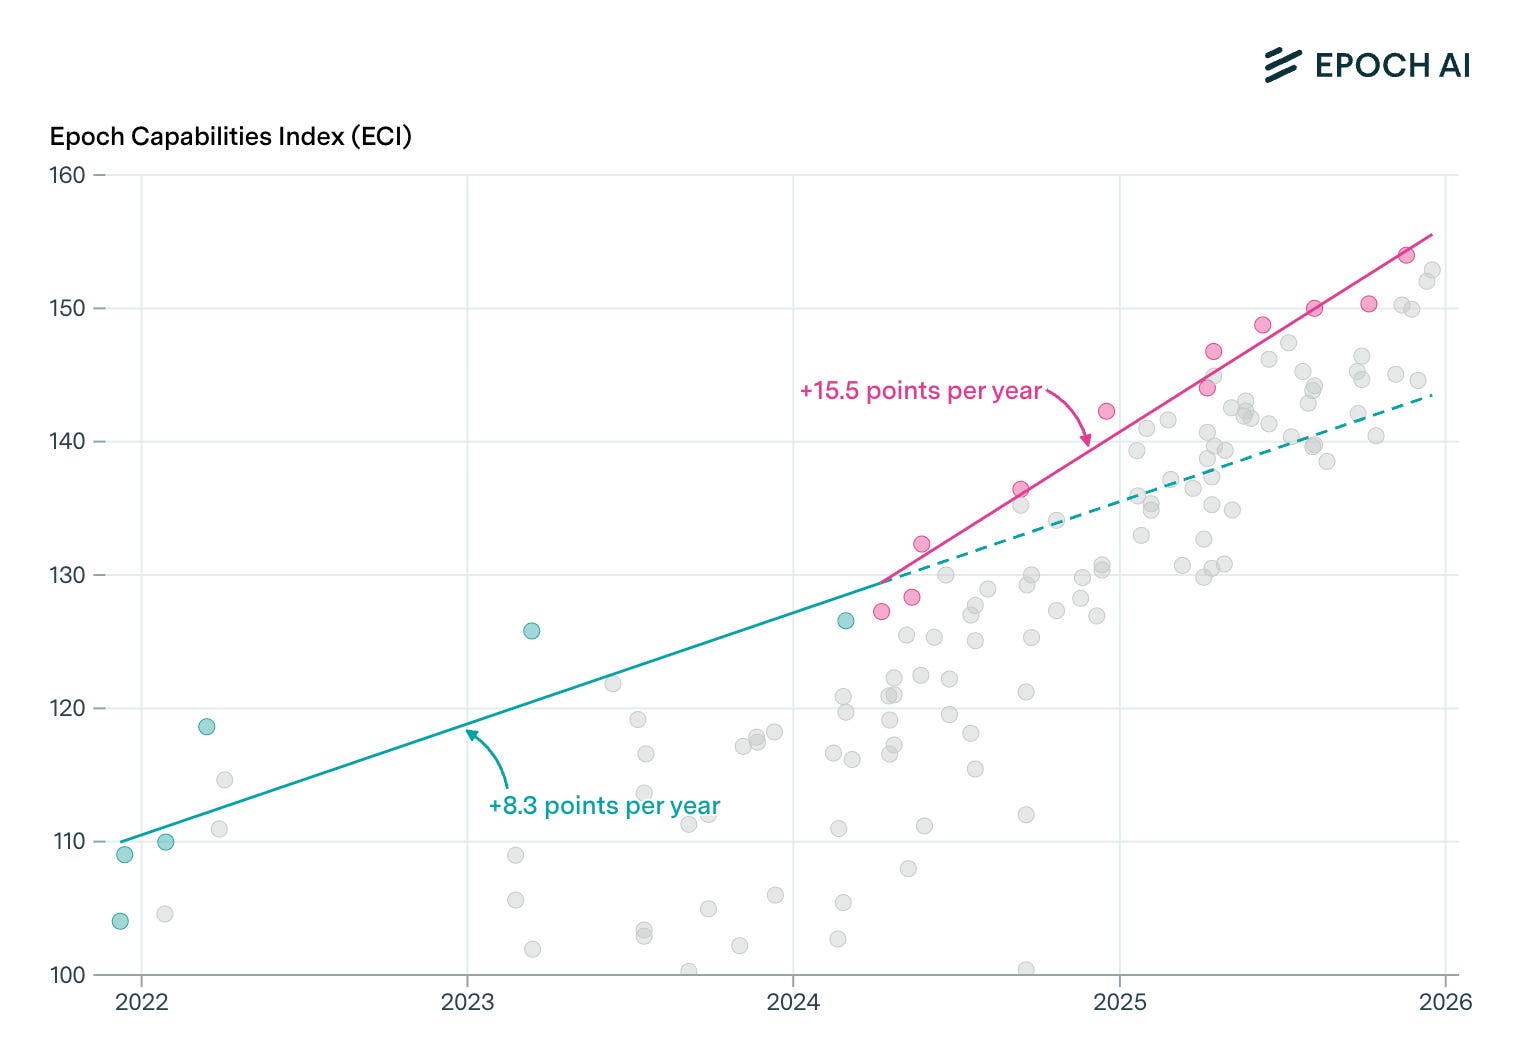
Looking closely at the METR chart, there actually seem to be two different trends – a fast trend and an even faster trend that started at some point in 2024.2 This is easier to see on a logarithmic scale:
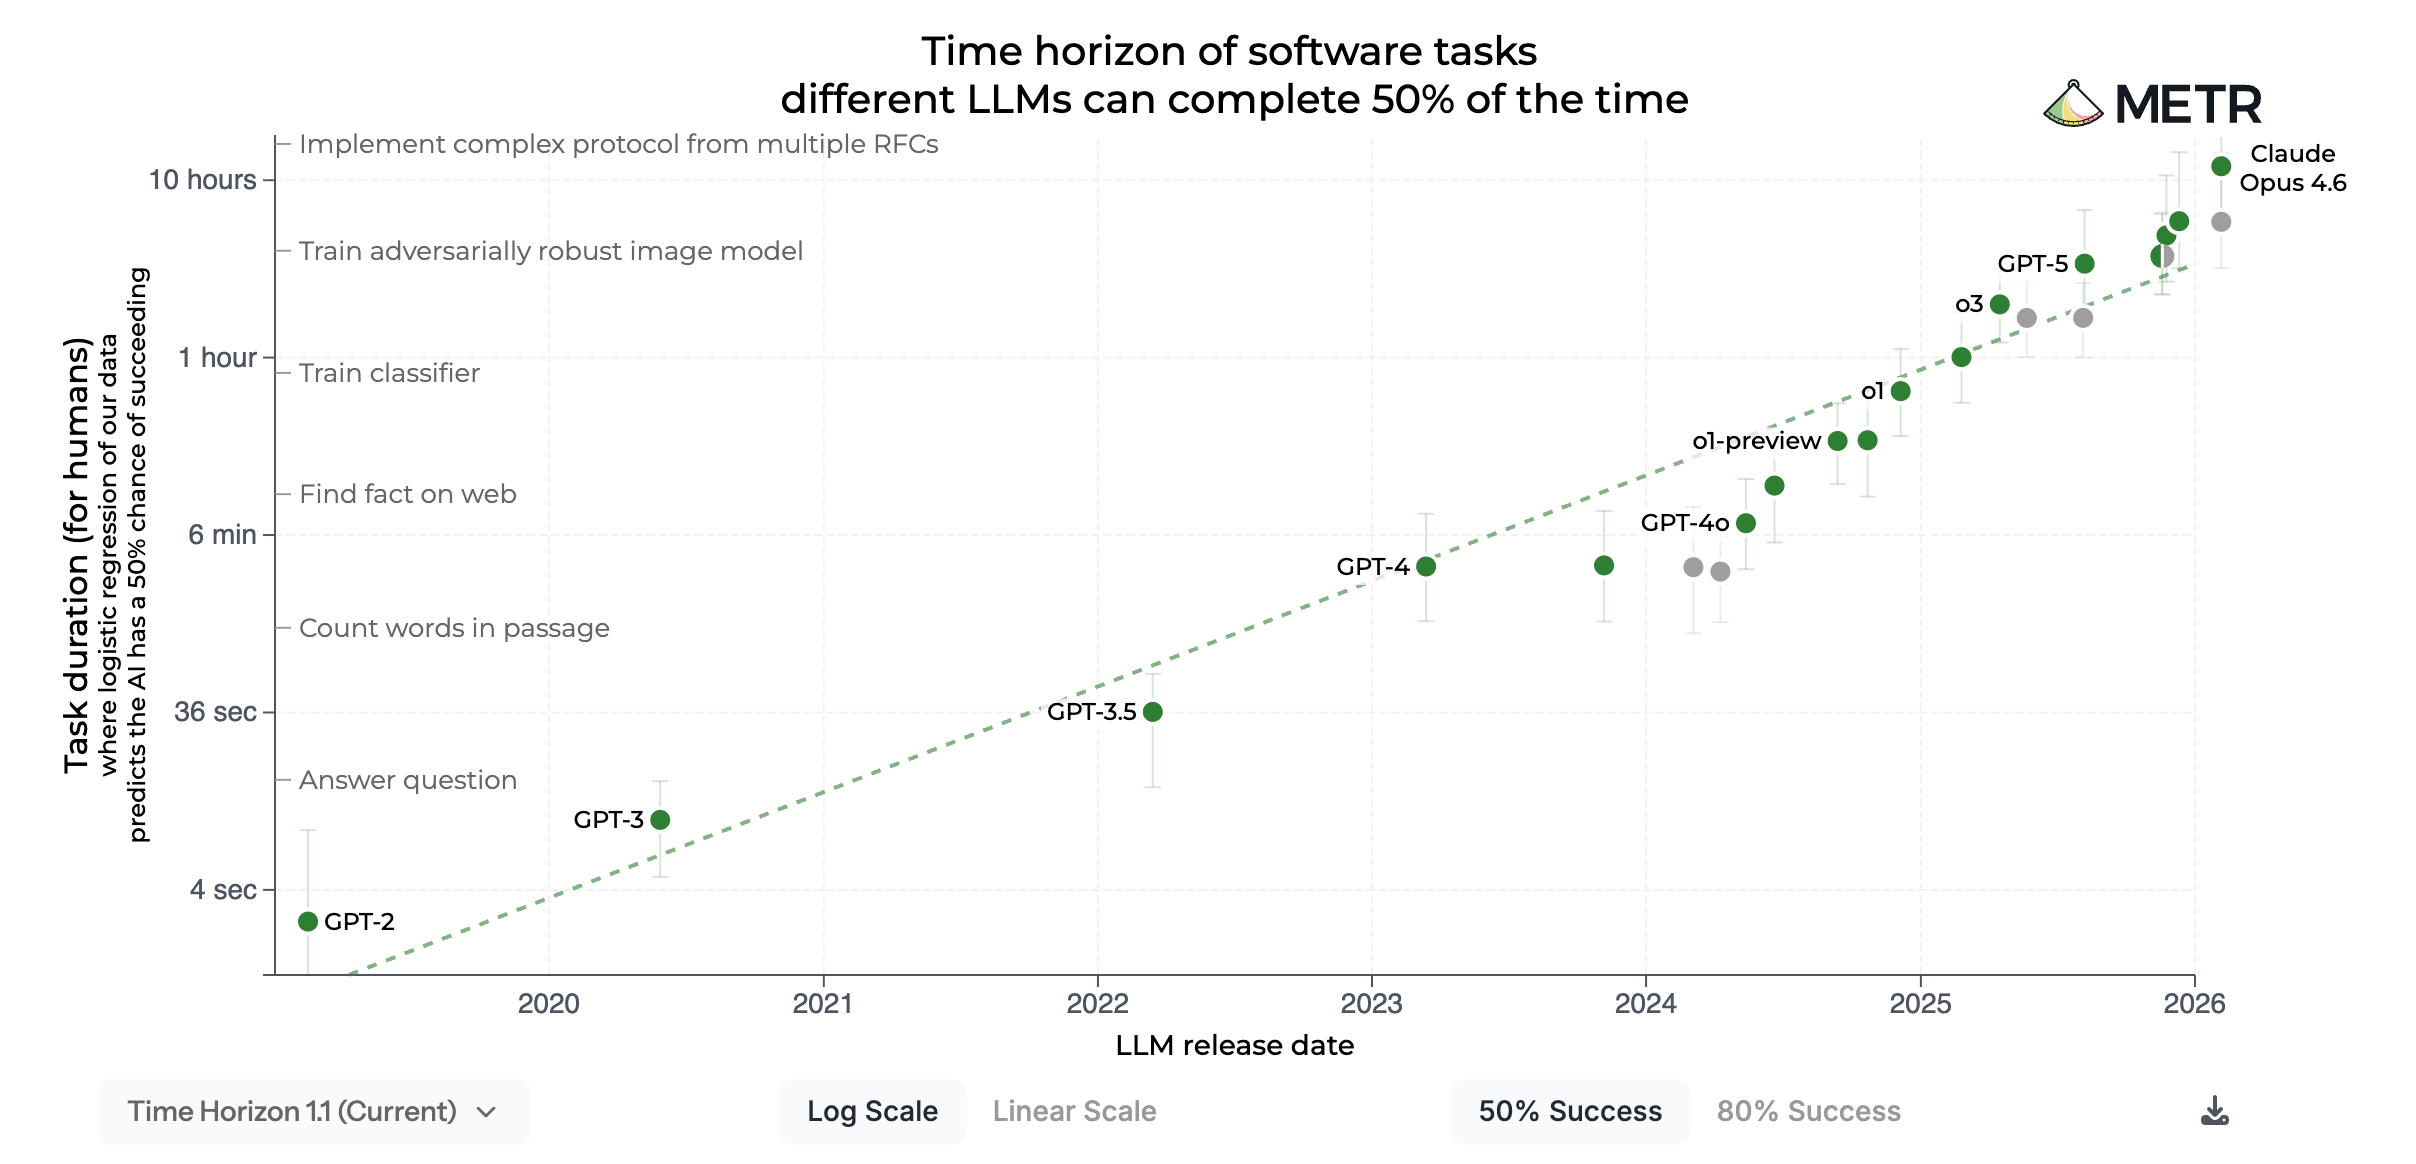
In the course 2024, models appear to break out of the trendline, with time horizons growing faster than the historical rate would predict. One interpretation is that with the advent of reasoning models like OpenAI’s o1, the doubling time of time horizons shortened even further to around 3.5 months, much faster than the historical trend of around 7 months. The following chart by the research organization Epoch AI, which tracks AI capabilities across a range of benchmarks, points in a similar direction:
What can we learn from this speedup? Reasoning models were a breakthrough in how AI models are trained: AI developers got their models to think through complex problems step-by-step and to productively use more computational resources for that. The outcome was much better performance at various tasks that require logical thinking.
Breakthroughs like this are hard to anticipate, and I’m not making a prediction here. But if there were another such breakthrough in 2026 – which some insiders have alluded to, for example around continual learning – it’s possible that progress accelerates even further. Even at the current pace, AI capabilities are increasing extremely fast. Either way, the current AI paradigm is clearly not hitting a wall so far.
3. We’ve just lost our yardstick.
As I said, the longest time horizon at the time of writing is 12 hours. This is close to the maximum of what METR can currently measure: as longer tasks are becoming increasingly expensive to build and validate, their task suite will soon be unable to estimate time horizons for the best models. For this reason, the most recent data points are especially noisy, and could potentially over- or underestimate the true value by a significant margin. (Even if it’s noisy, the latest data point still seems to invalidate a recent argument against the idea that the METR chart shows exponential AI progress.)
While METR is actively working on expanding its task suite, keeping up with exponential growth will be a challenge. This echoes the sentiment of this year’s International AI Safety Report, which found that AI capabilities are progressing faster than our ability to track them.
4. The METR chart only tracks software engineering tasks – but these might be the most important.
METR doesn’t estimate time horizons for any task that AI models can solve. Their paper explicitly focus on software engineering tasks, such as debugging code or writing Python scripts. This attracted considerable criticism when they first published their results: Some people claimed that it’s impossible to draw general conclusions about AI progress from such a narrow range of tasks.
It’s true that recent AI progress has been uneven, being much more rapid in some domains than in others – this is the so-called “jaggedness” of AI capabilities. Despite that, the METR chart remains one of the most important measures of AI progress. One reason is that METR has since found evidence of exponential patterns across multiple domains, including for AI capabilities in mathematics, science, computer use and autonomous driving.
The more important reason is that software engineering tasks play a special role in forecasting future AI progress. We could be in the early phase of what AI experts call recursive self-improvement – a stage of AI research where the next generation of AI systems isn’t built by humans, but by the AI systems themselves.
Though we’re not quite there yet, the main ingredients seem to be in place: Current AI models are trained partly on synthetic data generated by other AI systems (in a way that doesn’t generally degrade model performance, as some researchers suspected shortly before AI companies started using this technique at scale). AI models are now being used to optimize the chips on which these models run. According to OpenAI, its most recent model, GPT‑5.3‑Codex, “was instrumental in creating itself”; Anthropic similarly reports that its researchers now “build Claude with Claude”.
None of these feedback loops is fully autonomous yet. But the better AI models become at software engineering, the nearer we get to closing the cycle. That’s why companies like OpenAI or Anthropic – and a sizable fraction of global financial capital – now bet on coding automation: A major part of AI R&D is just software engineering. If AI companies had an AI agent that coded better than the best humans, they could use it to speed up AI R&D further. This makes the METR chart a leading indicator of AI progress even though it just tracks AI capabilities in a fairly narrow range of tasks.
Bottom line
Benchmarks show AI capabilities to progress at an exponential rate. Since AI is inherently dual-use, this can have both good and bad effects. Scientists could use increasingly autonomous AI for drug discovery, just like malicious actors could use the same systems to create pathogens. AI could boost economic growth, while at the same time disrupting the labor market.
While several uncertainties remain – e.g. on how benchmark progress relates to real-world utility, the METR chart suggests that, like all exponentials, this future might be coming for us faster than we intuitively appreciate. No government around the world is currently prepared for this. The METR chart is one of the things they should monitor closely.
The AI itself will usually be much faster than the human experts in solving the tasks.
At least, this is true for the version of the chart with a 50% reliability threshold. The 80%-reliability version is more ambiguous in this regard.